
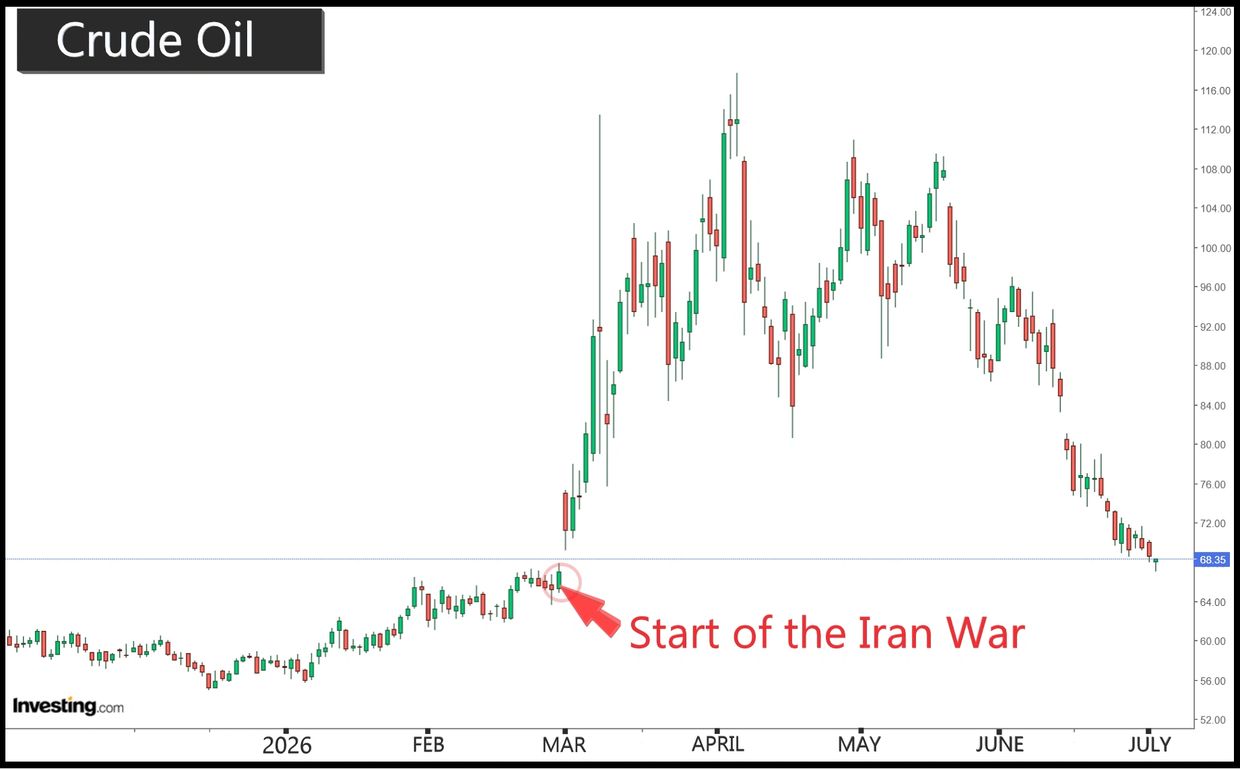
July 2, 2026 - Oil Falls to Pre-Iran War Levels
The price of oil has fallen dramatically since the U.S. and Iran signed a memorandum of understanding to end the confrontation.
The price of oil peaked just over $117 USD per barrel in April and fell below $70 USD per barrel at the time of writing this article, which is a fall of about 40%.
Although inflation came in at 3.20% in May, excluding the price of gasoline, inflation was well below 3.00%, with most non-energy items showing very little inflation, which means high oil prices did not raise prices of goods that are susceptible to price increases when the price of oil is high.
Fixed interest rates had risen with the rise in oil prices due to government bond yields rising as investors expected higher inflation. The yields have not yet fallen to pre-war levels like the price of oil has, mostly due to May’s inflation statistics, but the lower price of oil should ease inflation, which will bring the yields down, and fixed rates as well.
June 22, 2026 - Inflation Temporarily Up Due to Iran War
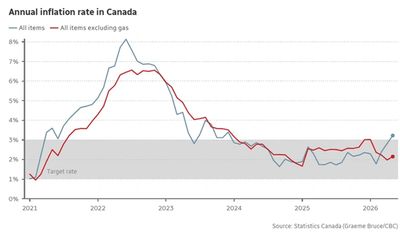
Canada annual rate of inflation rose to 3.20% in the month of May due to the increase in the price of oil as a result of the Iran war. Oil is the main contributor to inflation due to it’s impact on the cost of transportation, manufacturing, agriculture and almost all sectors of the economy that provide material goods, as well as sectors such as travel and tourism.
This rise in inflation was expected due to the rise in oil prices but expected to ease as oil prices have been falling since a peace agreement was reached between the U.S. and Iran.
In the chart above provided by Graeme Bruce of the CBC, you can see the if we exclude gasoline prices from the equation, inflation barely rose, even though prices on other items would have felt upward pressure from higher energy prices. Excluding gasoline, inflation still remains well below the 3% Bank of Canada threshold.
We should not expect the Bank of Canada to raise rates just because overall inflation is temporarily over the Bank of Canada’s comfort threshold. Inflation will come back down as the price of oil falls and the Canadian economy continues to perform poorly.
Government of Canada bond yields rose slightly on the inflation news, but not by an amount that would be deemed as significant, and the long term trajectory of fixed rates remains downward.
June 10, 2026 - Bank of Canada Leaves Policy Interest Rate Unchanged
The Bank of Canada has kept the policy interest rate unchanged, meaning there will be no changes for those in variable rate mortgages.
Bank Governor Tiff Macklem stated that the governing council agreed to look through the Iran war’s near term impact on inflation, but if energy prices stay high, they will not let their effect become broad based, persistent inflation.
The Governor stated that the “Canadian economy remains soft” while inflation is increasing due to elevated oil prices caused by the Iran war.
According to the Governor, there is little evidence that higher energy prices have passed on to other consumer prices, and that measures of core inflation have moved down to around 2%, and the share of CPI components growing above 3% is close to it’s historic average. This statement showed that there is currently a very low level of concern in the Bank of Canada when it comes to long term inflation.
Overall, the Bank expects CPI to hover close to 3% in coming months, before easing gradually to 2%.
Macklem stated that raising rates to slow inflation could further dampen the Canadian economy, while easing rates to support growth, raises the risk of higher inflation. For now, keeping the policy rate unchanged balances those risks.
Inflation in the U.S. rose above 4% according to today’s statistical announcement, but Macklem mentioned that inflation was lower in Canada than the U.S. prior to the war, and that the poor performance of the Canadian economy compared to that of the U.S. is keeping inflation lower in Canada.
The Bank of Canada next meets again July 15th.

June 1, 2026 - Canada Enters Recession Territory
The Canadian economy contracted in the first quarter on an annualized basis, making it the second consecutive quarter of contraction, which would technically qualify as a recession.
With this recent data, the normal thing for fixed rates to do would be to fall, yet fixed rates are close to half a percent higher than they were prior to the Iran war. This is entirely due to the investors speculating that the rising price of oil will cause inflation, which is certainly correct, but what will really matter is the duration of the conflict, and in particular, the amount of time it takes to allow oil baring vessels to begin travelling safely through the Strait of Hormuz.
The price of oil affects the cost of shipping, transportation, manufacturing, agriculture, plastics, tourism, and more, so when the price of oil goes up, the price of almost everything goes up. This causes inflation.
Government of Canada bond yields are the basis for fixed Canadian interest rates. Fixed interest rates rise when the price of oil goes rises because investors sell their bonds due to higher inflation lessening profit on bonds. This then causes the yields on the bonds to rise to entice more buyers because higher yields provide higher profit from the bonds. Since fixed rates are measured against Government bond yields, fixed rates rise as a result.
The Canadian economy is performing terribly, with no immediate foreseeable sign of improvement, so if it were not for the war in Iran, fixed rates would likely continue their downward path, and the Bank of Canada would likely lower rates in the future because failing economy causes less household spending, which lessens the demand for goods, which lowers inflation.
Canada currently has high and rising unemployment, our GDP per capita will soon be less than all U.S. states, including Mississippi, which has the lowest GDP per capita of all U.S. states, Canada's national GDP remains low, we have extremely high youth unemployment, unaffordable housing for most, and the cost of food is extremely elevated with no sign of falling. Bankruptcy rates and delinquencies on mortgages are rising sharply.
The Canadian business sector is shrinking, and with closures outpacing new registrations. Canada is experiencing an “entrepreneurial drought."
There are no industries in Canada that are likely to see significant expansion in the near term besides the temporary rise in oil prices which may benefit Alberta, and some growth mining industry, which employes less than 1% of the population .
Also, the Canada-U.S.-Mexico Agreement (CUSMA) is up for renegotiation on July 1, and it has been made clear by the current U.S. administration that their intention is to make trade much less favourable to Canada than the current agreement allows.
Basically, at this time interest rates are in a tug of war between a failing economy, which puts downward pressure on interest rates, and high oil prices, which puts upward pressure on interest rates.
Since it is in the best interest of Donald Trump and the Republican party to bring the price of oil down and end the war in Iran prior to the midterms, we should expect to see some type of agreement reached, even if it is slightly fictionalized by the current U.S. administration, order to achieve these interests. This would allow both fixed and variable rates to fall going forward.
May 8, 2026 -- Job Losses and Interest Rates
The Canadian economy shed 17,700 jobs in the month of April as the Canadian economy continues to deteriorate under the high cost of living and low level of economic growth.
Since the beginning of 2026, Canada is down 112,000 jobs with no signs of improvement in the months ahead.
Job creation remains under the continual threat of layoffs due to budget constraints, AI and automation, and a lack of consumer spending as a result of the majority of Canadians spending their entire incomes on food, shelter, and taxes.
The participation rate, which is the portion of the population over the age of 15 that are economically active, rose to 65% in the month of April, indicating that more Canadians are looking for employment that the months before.
Government of Canada bond yields fell on this news, for the reason that these statistics show signs of a slowing economy. This also creates less pressure on the Bank of Canada to raise their key policy rate since a weakening economy reduces price inflation.
The Iran war has caused a temporary rise in the price of oil, and due to oil’s impact on the cost of shipping, transportation, manufacturing, farming, and plastics, the rise in oil prices will cause inflation until the war has ended and the price of oil falls to pre-war levels.
It seems evident at this point that the Trump administration is trying to end the war as quickly as possible in order to reduce the price of oil and lower the cost of living once more before the midterm elections since in a democracy, the economy and standard of living are deemed as the most important topic in elections.
This is why fixed rates and the Bank of Canada’s policy interest rate are expected to stay at current levels until the end of the war. Following the end of the war, we expect fixed rates to fall, and the Bank of Canada to lower their policy rate in future meetings.
April 29, 2026 -- Central Banks Keep Rates Unchanged
It was a big day for interest rates today in North America as both the Canadian and US central banks held rate announcements.
The Bank of Canada
The Bank of Canada chose to maintain their key policy interest rate, leaving variable rates on mortgages unchanged
In his speech, Bank of Canada Governor Tiff Macklem stated that:
“So far, there is little evidence that higher oil prices have fed through to other goods and services prices more broadly, but it is early days, and we will be watching this closely. We will also be closely monitoring inflation expectations. Near term inflation expectations have moved up with higher gasoline prices and still elevated food price inflation, but longer term inflation expectations remain anchored”.
Based on the Bank’s forecast for oil prices, Governor Macklem stated that “Inflation should peak at about 3% in April, then ease back to the 2% target by early next year”
Macklem mentioned in his speech that the factors which will drive future Bank of Canada interest rate policy decisions are:
1) The Canada – US – Mexico trade agreement. If an agreement is unfavourable to Canada, this may cause the Bank to lower the policy rate to stimulate economic growth.
2) How the conflict in the Middle East evolves. If the duration of the war is longer than expected, and the price of oil stays elevated for a long period of time, it could bring rising inflation and cause the Bank to raise rates in the future.
3) The impact of US tariffs on our economy. If new tariffs are introduced, they may slow the Canadian economy and cause the Bank to lower the policy rate to promote economic growth.
Governor Macklem mentioned in his speech that, if energy prices remain high, they will not hesitate to make adjustments in their policy rate to bring inflation back down to target levels, so it seems that the future of policy rate decision is dependent on the duration and outcome of the Iran war... If it were not for the Iran war, inflation in most sectors would continue to fall, and the Bank would continue to lower their policy interest rate.
The Federal Reserve
On the other side of the border, the Federal Reserve also maintained their federal funds interest rate, seeing their current stance on interest policy appropriate based on the current level of US inflation and economic growth.
The US is facing similar inflationary factors as Canada, yet has a slightly higher level of overall inflation due to the impact of tariffs on their economy, which have increased prices of imports.


April 20, 2026 -- Inflation rises to 2.40%
The annual of inflation rose to 2.40% in the month of March, mainly due to a 21.2% rise in the price of gasoline caused by the U.S./Israel war with Iran.
The price of oil affects the price of most goods due to its impact on costs related to manufacturing, shipping, packaging, and more, however we have not yet seen dramatic increases in the cost of non-energy related products.
Due to the lackluster state of the Canadian economy, it is extremely unlikely that the Bank of Canada will raise their policy interest rate, so we can expect variable rates to remain unchanged.
Fixed rates are likely to stay at current levels as well since Government of Canada bond yields are well below their 2026 peak which occurred March 19.
April 1, 2026 -- Iran War, Oil, and Interest Rates
Fixed rates are now close to half a percent higher than they were prior to the Iran war. This is entirely due to the investors speculating that the rising price of oil will cause inflation, which is certainly correct, but what will really matter is the duration of the conflict, and in particular, the amount of time it takes to allow oil bearing vessels to begin travelling safely through the Strait of Hormuz.
The price of oil affects the cost of shipping, transportation, manufacturing, agriculture, plastics, tourism, and more, so when the price of oil goes up, the price of almost everything goes up. This causes inflation.
Government of Canada bond yields are the basis for fixed Canadian interest rates. Why fixed interest rates go up when the price of oil goes up is because investors sell their bonds for the reason that higher inflation lessens profit on bonds. This then causes the yields on the bonds to rise in order to entice more buyers because higher yields provide higher profit from the bonds. Since fixed rates are measured against Government bond yields, fixed rates rise as a result.
If the war in Iran is indeed close to ending, as the Trump administration is claiming, the rise in fixed rates will be temporary. Once the price of oil falls, government bond yields will fall, and so will fixed interest rates, due to Canada's failing economy.
Unlike fixed rates, the variable rate is measured against the Bank of Canada's policy interest rate. When the Bank of Canada raises the policy rate, variable rates rise, and vice versa. The Bank of Canada meets eight times per year to decide whether to raise, lower, or maintain the overnight rate.
The two main factors the Bank of Canada considers when determining the policy rate are inflation and economic growth. When the economy is growing at a fast pace, inflation is likely to rise in the future, so the Bank will raise rates pre-emptively in order to stop inflation before it happens.
At the moment the Canadian economy is performing terribly, with no foreseeable sign of improvement, so if it were not for the war in Iran, fixed rates would likely continue their downward path, and the Bank of Canada would likely lower rates in future meetings. A failing economy causes less household spending, which lessens the demand for goods, which lowers inflation.
This being said, the Bank of Canada is in a tough position due to the Iran war. If they raise the policy rate, it will slow the economy further and lead us into a deeper recession than the one we are likely entering into, but if the war in Iran is prolonged, and the price of oil stays elevated for a long enough period of time, causing longer term inflation, the Bank of Canada may have to raise rates slightly to slow inflation.
Variable rates are currently much lower than fixed rates, so even if the Bank of Canada were to raise the overnight rate by 0.50% to calm future inflation (which is a large increase for them) the rate will still be below the current fixed rate, and if they do raise the rate by this amount, it will very much reduce economic growth in Canada.
The Bank of Canada today released their Summary of Governing Council Deliberations, which echoed much of what I have written above. Some notable points made by the Bank in its publication were:
“The war in Iran had clearly added a new layer of uncertainty, but they agreed that they should not lose sight of the other risks already facing the economy: shifting US trade policy, the upcoming review of the Canada-United States-Mexico Agreement, and ongoing structural changes”.
“Typically, higher inflation expectations make it easier for businesses to pass along cost increases. But when the economy is soft, firms often look for ways to avoid raising prices so that they don’t lose customers. Similarly, upward pressure on wages is less likely in a weak economy”.
“Governing Council members believed it was too early to assess the impact on the outlook and how these risks would materialize. They therefore agreed to hold the policy interest rate unchanged at 2.25%.”
If you are in a variable rate and concerned about the chance that your mortgage payment will rise, please call or email me to discuss options.
Although it is my opinion that remaining in a variable rate will save borrowers the most money going forward, there is no guarantee that the war will end quickly and the price of oil will fall to pre-war levels in the near term.


March 18, 2026 -- No Change by the Bank of Canada, Iran War, Oil, and Mortgage Rates
Due to a recent spike in the price of oil as a result of the Iran war, the Bank of Canada held their key interest rate steady this month, meaning there will be no change for mortgage borrowers in variable rate mortgages.
There was possibility of a rate cut this month due to the recent inflation statistics showing Canada’s inflation level at 1.80%
The Bank of Canada stated in their meeting that they are trying to weigh the difference a spike in oil prices will have between Immediate vs. long term inflation.
If the conflict ends quickly, or if shipment of oil though the Strait of Hormuz returns to previous levels, then the impact the war will have on inflation will be short term and minimal, but if the conflict persists and oil is not able to flow freely through the Strait of Hormuz, it could have a long term impact on inflation.
From an immediate inflation perspective, corn and wheat futures prices have been fairly stable since the beginning of the Iran war, so currently, rising oil prices do not seem to be putting very much upward pressure on food prices and are mostly just affecting gasoline prices.
The chart in this article illustrates the large spike in oil prices compared with the extent of the rise of the 5 year Government of Canada bond yield, which is the basis for 5 year fixed mortgage rates in Canada. You can see in the chart that the yield has not risen by nearly the same degree as the price of oil.
Unfortunately, oil is priced globally rather than regionally, which is why we are seeing such a large spike in prices in Canada, even though only a small percentage of our oil is imported from the Middle East.
About Monday’s Inflation data release
Canada’s annual rate of inflation fell from 2.30% to 1.80% according to statistics Canada on Monday.
Food inflation remained uncomfortably high at 5.40%, and items related to health and personal care were slightly high at 3.50%, however inflation on items such as shelter, household goods, clothing and footwear, as well as recreation and reading, all came in below 2.00%.
Much of what has brought inflation down over the past year has been a drastic decrease in energy prices of 9.30%, with gasoline prices being the largest contributor with an annual decrease of 14.20%.
This fall in energy prices however will be offset in future data releases by the rise in oil prices caused by the Iran war. The price of oil rise by almost 50% from it's pre-war level at the time of writing this article. The price has fallen substantially since it peaked at close to $120 per barrel on the second weekend of the conflict, now sitting at just under $100 per barrel.
Despite the rise in oil prices which is temporarily causing fixed rates to rise, it is unlikely that the Bank of Canada will raise rates any time soon due to the terrible state of the Canadian economy.
Canada's Weak Employment
Canada’s economy saw a contraction of 0.60% for the fourth quarter of 2025, illustrating the decline in economic growth. Unemployment rose dramatically in February as Canada lost 84,000 jobs in just one month.
The U.S. economy is also slowing and experience rising job losses. A slowing U.S. economy reduces demand for Canadian goods and services, which will cause further slowing to the Canadian economy.
March 3, 2026 - War in the Middle East, and Fixed Mortgage Rates
Government of Canada bond yields have been on what seems like a roller coaster ride over the span of this week due to events taking place in the Middle East.
The price of oil generally has a significant impact on inflation since it affects the cost of production, shipping, and transportation. Due to its impact on inflation, government of Canada bond yields often mimic the price direction of oil, which is the reason for the yields’ behaviour this week.
At the time of writing this article, we have not seen increases in fixed rates with any of our lenders, however fixed rates may rise slightly in the days ahead, but the rise will likely be small and temporary.
Normally when conflicts occur in the Middle East, a temporary rise in the price of oil occurs, just like we are seeing this time, and after the conflict seems to be settled or under control, the price of oil falls back to previous levels.
Our mortgage lenders have not priced in the full amount of decrease we have seen in bond yields since December’s better than expected jobs data, which in a sense, fooled investors into thinking Canada’s job market had been expanding, when in fact it was almost all part time and temporary jobs that were created.
The lack of decrease in rates compared with bond yields over the past two months gives the lenders room for the yields to rise slightly before needing to raise rates.
The chart above illustrates the path of the 5 year government bond yield over the past couple of days. Overall, there yield had risen a total of about 21 basis points since the weekend but has come back down showing a total increase of 12 basis points for the week, which would only be enough to make fixed rates rise by about 12 basis points overall (or 0.12%).
U.S. president Donald Trump stated today that, “If necessary, the United States Navy will begin escorting tankers through the Strait of Hormuz, as soon as possible. No matter what, the United States will ensure the free flow of energy to the world”. Since the factor which has caused yields to rise is the possibility of a short term disruption in the supply chain of oil from the Middle East, allowing the tankers to continue to reach their destinations will ease concerns about oil prices.
